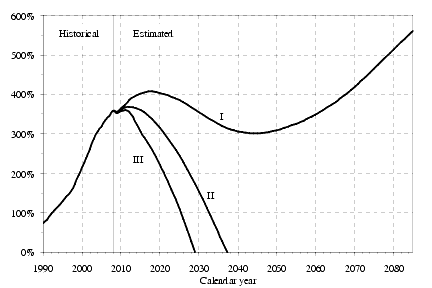
The 2009 data is out. If you’ve followed any of my previous posts, you’ll understand that this is the key figure, the long-term projections:

Due to the economic crash of the last couple years, we are turning into the bad parts of the curve. We are no longer adding to the SS surplus, we are starting to draw on it. How long can that last for? Using their scenario II (in another post I’ve shown why this is overly conservative), it lasts until 2037 or so. The Congressional Budget Office has their own calculations, and they show the fund lasting until 2043. After the fund runs out, we pay out more than we are taking in. We come up with a way to balance the books then, or make minor changes to balance the books now.
The last time we checked in, the fund was depleted in 2041. So in one year, it’s gone down four years. That is not good. However, this is nothing like bankruptcy. This is like saying your expenses have gone up and you are spending more than you make, but fortunately you have an enormous nest egg that you’ve diligently saved up. I can’t show the image here, but check out Figure 3 of the CBO report. You’ll see why there isn’t much to worry about.
So sleep well. Even with the economic disaster of the last couple years, social security is in good shape.
not as good at the fart post.